What is Nivo Library?
Nivo is a powerful data visualization library for React.js applications, It provides many customizable chart components that we can directly use inside our React application. Nivo in React.js provides stunning visualization of data sets via different types of charts.
Some of the Nivo library chart types are bar charts, pie charts, scatter charts, area bump charts, line charts, treemap charts, and many more options we have in the Nivo library.

Each of the chart components is configurable and you have the option to customize its labels, colors, tooltips, animation, and many more customizable options.
Nivo in React.js has many advantages of using it for data visualization, All charts of the Nivo library are responsive, which means these charts can automatically adapt the different orientations according to the screen size of devices.
Nivo in React.js has many color scheme options, it supports modern web technologies like HTML5 Canvas and SVG for chart rendering.
Now to use Nivo in React.js we need to install it, One of the best parts of the Nivo library is, we can only install the chart we want to use in our project, there is no need to install the complete library. It makes it lightweight in use and reduces the size of the overall project.
If you use the React Icons then you must know how we only use the required icons, we don’t add all icon libraries to our project. we have an article on How to add icons in React, Check it out.
In this example, we are only explaining the Nivo bar chart, For the rest of the charts you just need to follow the same process which I am explaining below. For most of the charts, you just need to add the data file and Nivo pre-defined chart component inside your App component return, and don’t forget to import the chart components.
Install the necessary packages:
Whatever chart you want to use in your React.js project, just install it and start using it.
npm install @nivo/bar //for bar charts
npm install @nivo/line // for line charts
npm install @nivo/bump // for area bump charts

//simmilar way you can install the other charts
For our example, we need to run the bar chart command.
Now, Import the required components in your React component:
Here we have created a new Javascript file BarChart.js which we will import into our App component file.
import { ResponsiveBar } from "@nivo/bar";
const BarChart=({data})=>{
return(
// Your Chart Component code goes Here.
)
}
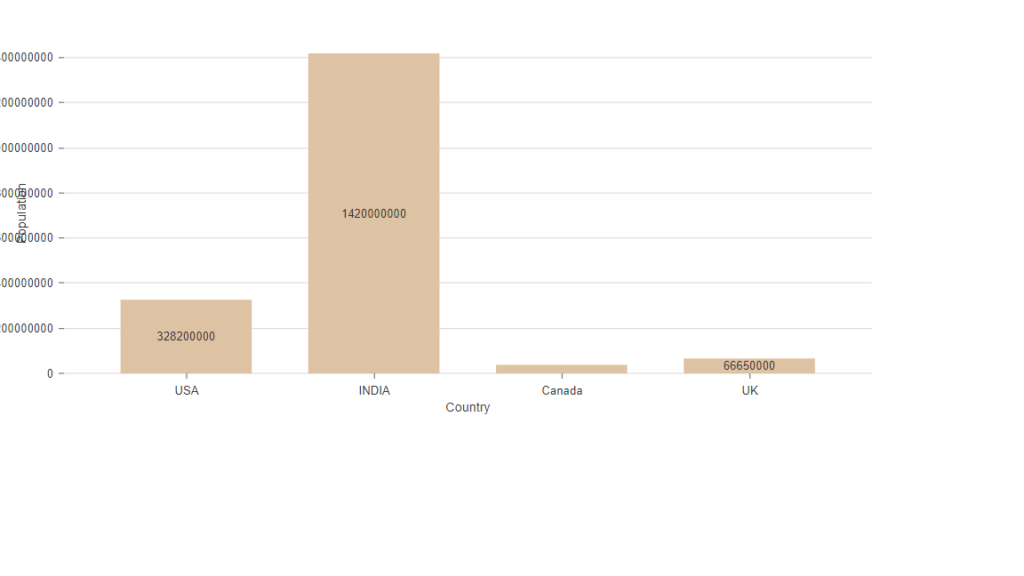
export default BarChart;Below is our data set which is representing the population of famous countries, one thing you need to take care, always use these data sets inside separate javascript files and import them and use them inside the project, don’t define your dataset inside the chart component.
Here we are creating a barChartData.js file in the root and will import it to our BarChart.js Component.
We are creating these files inside the root for now, otherwise, we should use the proper folder structure in our project.
const barChartData = [
  { country: 'USA', population: 328200000 },
  { country: 'INDIA', population: 1420000000 },
  { country: 'Canada', population: 37590000 },
  { country: 'UK', population: 66650000 },
];
export default barChartData;
ResponsiveBar is the component we will use inside our React Component to display our chart with the above data set. Here is the Complete code of the BarChart.js file which includes the <ResponsiveBar> which is the Nivo bar charts component.
import { ResponsiveBar } from "@nivo/bar";
const BarChart=({data})=>{ // We are getting this data from the App Component
    return(
        <div style={{ height: '400px' }}>
            <ResponsiveBar
            data={data}
            keys={['population']}
            indexBy="country"
            margin={{ top: 50, right: 50, bottom: 50, left: 60 }}
            padding={0.3}
            colors={{ scheme: 'nivo' }}
            axisBottom={{
                tickSize: 5,
                tickPadding: 5,
                tickRotation: 0,
                legend: 'Country',
                legendPosition: 'middle',
                legendOffset: 32,
            }}
            axisLeft={{
                tickSize: 5,
                tickPadding: 5,
                tickRotation: 0,
                legend: 'Population',
                legendPosition: 'middle',
                legendOffset: -40,
            }}
            labelSkipWidth={12}
            labelSkipHeight={12}
            />
        </div>
    )
}
export default BarChart;
Outer div with fixed height is very important to display these charts so don’t forget to add this above the <ResponsiveBar> Component, You can adjust the height according to your needs.
Now we need to import this BarChart Component inside our App Component as it is the main component that will show the User Interface.
We also need to import the barChartData.js file so we can use this object and pass it to the BarChart component.
import './App.css';
import BarChart from './BarChart';
import barChartData from './barChartData';

function App() {

  return (
    <div className="App">

       <BarChart data={barChartData}/>
    </div>
  );
}
export default App;
Now let me show you the output for the bar chart with our data set.
Checkout the official documentation for all the Nivo Charts Here https://nivo.rocks/
Nivo in React is a very useful library so try to use all the charts, Follow the steps carefully and you are good to go, if you like this article please share it with your friends. Happy Coding 🙂